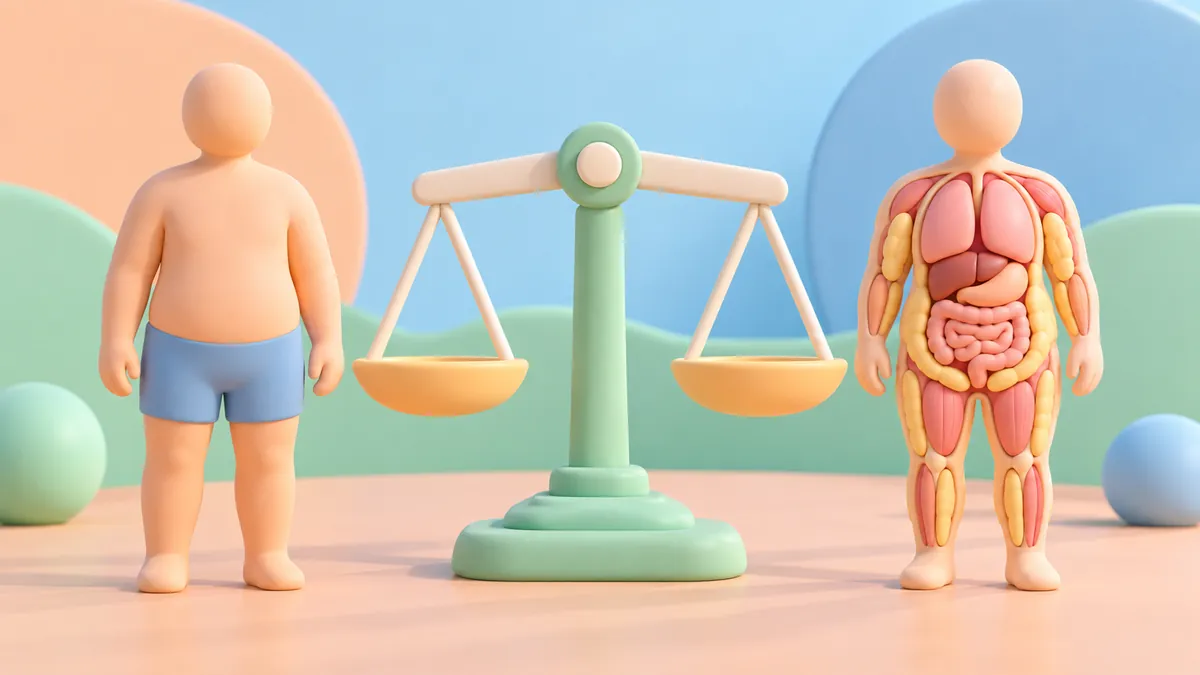
Two numbers dominate the "how am I doing?" conversation in fitness: BMI and body fat percentage. They both claim to describe your body, they often disagree, and most articles take a side. The honest answer is more useful than either side: they measure different things, and the best strategy is to use both — but for the right job.
Quick Answer
- BMI is a screening tool. It is fast, free, and a decent flag for population-level health risk, but it cannot tell muscle from fat.
- Body fat percentage is what your body is actually made of. It is harder to measure, but it tells the real story when BMI is misleading.
- Use BMI for a quick check. When it disagrees with how you look or feel, trust body fat percentage.
What BMI Measures
Body Mass Index is a single ratio: weight divided by height squared.
BMI = weight (kg) / [ height (m) ]² Imperial: BMI = 703 × weight (lb) / [ height (in) ]²
WHO classifies adult BMI into four bands:
| BMI | Category | |---|---| | < 18.5 | Underweight | | 18.5–24.9 | Normal weight | | 25.0–29.9 | Overweight | | ≥ 30.0 | Obese |
That is the entire formula. You can compute it in two seconds with our BMI Calculator.
The strengths are exactly the things people criticise: it ignores everything except weight and height. No equipment. No measurement training. No body composition study required. That is why doctors use it as an opening screen for huge populations.
What Body Fat Percentage Measures
Body fat percentage answers a different question: of all the weight you carry, how much of it is fat?
The rest — lean body mass — is muscle, bone, water, organs and glycogen. Two people can weigh exactly the same and look entirely different because their fat-to-lean ratio differs.
Typical adult ranges:
| Category | Men | Women | |---|---|---| | Essential | 2–5% | 10–13% | | Athletic | 6–13% | 14–20% | | Fitness | 14–17% | 21–24% | | Average | 18–24% | 25–31% | | High | ≥ 25% | ≥ 32% |
Body fat percentage directly describes composition. It is why coaches and clinicians often prefer it to BMI when decisions hinge on muscle.
Where BMI Wins
BMI is not stupid. It has been validated against health outcomes in millions of people for decades. For:
- A first-pass health check in a population without other data
- Tracking weight trends in someone whose body composition is roughly stable
- Cheap, repeatable measurement anywhere in the world
…BMI is hard to beat. If two adults have BMIs of 22 and 33, the second one almost certainly carries more fat than is healthy. That is a useful signal even without a body fat scan.
Where BMI Fails
BMI breaks down in any situation where muscle, frame size or body composition differ from the "average" assumed in the formula:
- Athletes and lifters. Heavy muscle pushes BMI into "overweight" or "obese" without high fat. A bodybuilder can hit BMI 30 at 10% body fat.
- Older adults. Sarcopenia (age-related muscle loss) means BMI can stay "normal" while fat mass rises and lean mass falls — sometimes called normal-weight obesity.
- Tall vs. short adults. BMI under-estimates the heaviness of very tall people and over-estimates very short people, because real bodies do not scale as a perfect square of height.
- Different ethnic distributions of fat. Some populations show higher cardiometabolic risk at lower BMIs (Asian thresholds for "overweight" often start at 23).
- Children and teens. Adult cut-offs do not apply. CDC age- and sex-specific percentiles are used instead.
BMI is a screen, not a diagnosis. Treating a single BMI number as the final word on someone's health is the most common misuse of the metric.
How Body Fat % Adds Context
Body fat percentage answers the questions BMI cannot:
- Is the gain muscle or fat? A 2 kg gain at the same BMI could be either; only body fat % can tell.
- Is recomp working? A lifter who loses 2 kg of fat and gains 2 kg of muscle sees no BMI change. Body fat % drops clearly.
- Where is the fat? Methods that estimate visceral fat (notably DEXA) flag the most metabolically risky kind.
- Is the goal realistic? "Get to 15% body fat" is a more meaningful target than "lose 5 kg" if the 5 kg includes muscle.
Our Body Fat Calculator uses the U.S. Navy circumference method, which gets you within a few percentage points of a DEXA scan if you measure carefully.
How to Measure Body Fat — and Their Trade-offs
| Method | Accuracy | Cost | Notes | |---|---|---|---| | U.S. Navy tape | ±3–4% | Free | Needs only a tape; consistent measurement points matter | | Skinfold calipers | ±3–5% | Low | Operator skill matters; multi-site protocols best | | BIA (smart scales) | ±5–8% | Low–med | Hydration-sensitive; best for trend, not absolute | | DEXA scan | ±1–2% | $$ | Considered the practical gold standard | | Hydrostatic / Bod Pod | ±1–3% | $$ | Highly accurate; clinic-only |
Whichever method you pick, stay with it. A 2% absolute error matters less than measuring the same way each time so trends are real.
Worked Example: Same BMI, Different Story
Two 30-year-old men, both 175 cm and 80 kg → BMI 26.1 (Overweight) for both.
- Person A (10 years of lifting): waist 84 cm, neck 38 cm → ~13% body fat (US Navy). Lean body mass: 80 × 0.87 ≈ 69.6 kg. Health risk: low.
- Person B (sedentary office work): waist 100 cm, neck 38 cm → ~26% body fat. Lean body mass: 80 × 0.74 ≈ 59.2 kg. Health risk: elevated.
Identical BMI, very different bodies. This is the case body fat % is built for.
Using Them Together
The most useful workflow is BMI for the quick check, body fat % for the diagnosis.
- Compute BMI with our BMI Calculator.
- If BMI looks normal but you suspect "skinny-fat," or if BMI looks high and you train hard — compute body fat %.
- Track both monthly. A drop in body fat % with stable BMI is body recomposition. A drop in BMI without a body fat % drop usually means muscle and water loss.
- Layer on outcomes: blood pressure, waist circumference, lipid panel, strength, sleep, energy. No single number is the verdict.
Beyond BMI and Body Fat: Other Metrics Worth Knowing
BMI and body fat % are the two best-known metrics, but a few others fill specific gaps:
- Waist-to-height ratio (WHtR) — waist circumference divided by height. Under 0.5 is the broadly healthy band for adults. Often a better predictor of cardiometabolic risk than BMI alone, and trivial to measure.
- Waist circumference (WC) — at navel for men, narrowest point for women. Above 102 cm (men) or 88 cm (women) signals elevated risk regardless of BMI.
- Lean body mass (LBM) — total weight minus fat mass. The thing most lifters actually care about. Tracks recomp progress when BMI and weight don't move.
- A Body Shape Index (ABSI) — newer composite using waist + BMI + height. More accurate for mortality risk in some studies, but less intuitive.
- Body Adiposity Index (BAI) — uses hip and height; designed for populations without easy scales. Limited adoption.
For most people, the practical trio is BMI + waist circumference + body fat %. Adding more rarely changes decisions.
Tracking Change vs. a Single Snapshot
A single BMI or body fat % reading rarely matters. The trend over months is what reflects real change. A few rules:
- Monthly measurements for body fat % and waist; daily-then-average for body weight
- Same conditions every time — morning, no clothes, post-bathroom, before drinking
- 3-point change in body fat % is the threshold to declare a real shift (home methods have ~3% noise)
- 3 cm change in waist is meaningful
- Photos from the same angles and lighting every 4 weeks beat any number for visible feedback
If three of (BMI, body fat %, waist tape, photos) move the right way, the body is responding.
Special Populations
The "use BMI as a screen, body fat % as a diagnosis" framework needs adjustment for some groups:
Athletes and lifters
BMI will over-call obesity in muscular individuals. Body fat % is the relevant metric here, with strength tests as the bonus signal.
Older adults (65+)
Sarcopenia steadily lowers lean mass. BMI can sit in "normal" range while fat mass rises silently — normal-weight obesity. Body fat % and grip strength flag this earlier than BMI ever will.
Children and teens
Adult BMI thresholds don't apply. Use CDC growth charts with age- and sex-specific percentiles. Body-fat methods are also less validated for adolescents.
Different ethnic populations
Asian populations show cardiometabolic risk at lower BMI thresholds — many guidelines start "overweight" at BMI 23 rather than 25. Local guidelines beat universal ones.
Pregnancy
BMI is not designed for pregnancy. Weight gain targets come from pre-pregnancy BMI plus obstetric guidance, not from in-pregnancy BMI readings.
Common Misuses
- Diagnosing health from BMI alone. It is a screen, not a verdict.
- Comparing BMI between very different ethnic groups using the same thresholds.
- Trusting one BIA reading. Smart-scale numbers swing 2–3% with hydration; use weekly averages.
- Aiming for "essential" body fat as a normal target. Essential fat is the lower physiological limit, not a healthy steady state.
- Ignoring waist circumference. It correlates strongly with visceral fat and adds meaningful context to either number.
Frequently Asked Questions
Is BMI useless?
No. It is a fast, free screen with decades of population-level data behind it. It is only useless when treated as a final answer for an individual rather than a flag for "look closer."
What body fat % should I aim for?
For most healthy non-athletes, somewhere in the fitness or athletic ranges — roughly 10–17% for men and 18–24% for women — supports good health and quality of life. Lower can be appropriate for athletes; lower still is hard to sustain.
Can I lower BMI without losing muscle?
Yes, but the leaner you already are, the harder it gets. Strength training plus adequate protein during a calorie deficit is the proven combination. See our guide on weight-loss math and Macro Calculator.
Are smart-scale body fat readings accurate?
They use bio-electrical impedance, which is sensitive to hydration, food, time of day and skin contact. Accuracy is roughly ±5–8% in real life. Best used the same way every day to track a trend, not a daily snapshot.
Why don't doctors use body fat % more often?
Time and equipment. BMI takes seconds and needs only height and weight. Body fat percentage requires either training (calipers, tape protocols) or a machine (DEXA, Bod Pod). For population screening, BMI's speed wins.
Bottom Line
BMI and body fat percentage are not rivals. They are different tools for different jobs.
- Use BMI for a fast check, for tracking when composition is stable, and as a screening flag.
- Use body fat percentage when BMI disagrees with how you look or train, when you want to track recomposition, or when "lose weight" should really be "lose fat."
Run them both today with our BMI Calculator and Body Fat Calculator, and decide your next step from the picture both numbers paint together.
Health and fitness calculations are estimates only and not medical advice. If your numbers concern you — or you have an existing condition — consult a healthcare provider for a proper assessment.